Wednesday, November 23, 2005
research update
Hello,
I thought I would talk a bit about my research, for those of you who care. If you don't care, please find your way to the back button.
Actually, I will try to make this short. I want to give a brief synopsis, but still give enough details so that everyone is properly satisfied and not confuseled.
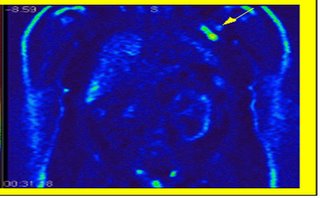
What I have been doing for almost 2 years now is working on a research PET scanner. PET scanners detect radioactive emissions that are injected into a patient. In a clincal setting, they are often used to detect cancerous lesions, b/c some flavors of injected radionuclide will go where there is a realitive high metabolic need and/or high blood flow (most tumors). An example of that is below. you can see a higher intensity green spot that suggests cancer. btw, this is a coronal slice of a human patient with a diagosis of breast cancer. the bladder is at the bottom and you can make out the lungs and sholders pretty well. (the bladder has "hot spots" b/c the radioactive molecules are beginning to be excreted, it is not bladder cancer)
In research, PET is used for all kinds of stuff. In fact, I don't even want to talk about it there is so much. our group is focusing on PET applied to cardiac/circulation system. There was a state-of-the-art extrememly high resolution PET imaging system built here on campus for use on research in small animals (rats, mice). It was just up and runnign this summer. IT was my task to preform what is known as "gating". where generally, one signal is timed with another. in this context, the images are timed so that we get 8 PET images that represent a 8th of the cardiac cycle of a rat. That sounds easy, but it isn't. What makes it tricky is that the "events" that make the image are captured for about an hour. it is like setting up a camara and opening the aperature for an hour and allowing light in that long. so obviously, the heart beats many times in that time frame, so the "events" that are recorded have to be organised by when they occured in the cardiac cycle. the image below should clear things up. it is color coded to signify each 8th of the cardiac cycle. an ECG is used to determine the cardiac cycle. and those 'S' things, well, those are precursors to images, so just think of them as images.
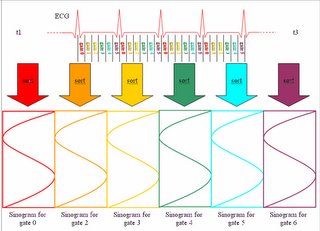
so as you can see, the events are orgainsed to different "bins" by when they happened in the ECG, and those events are then "sorted" into "sinograms"(the S things) and then directly turned into images. woohoo!
so, that allows sweet images like these:
(download this, open it)
this image is rotating so you can see all angles (I didn't do that) and also gated (I did that part). this is what is commonly called a "blood pool" image. the radioactive molecules I spoke of earlier go where the blood is. the moving blob at the top is the heart and the two decending things are the vena cava and the decending aorta (i think) of a rat. the bigger moving blob is the blood moving in and out the left ventrical, and the smaller moving blob is the blood moving in and out of the right ventrical. So, simply put, i did that. i made it look as though the heart is beating. before, the iamge wouldn't be moving at all and the motion would cause a smearing effect that would make the heart look kinda always open (diastole). this specific kind of image is mostly just cool to look at, it doesn't have much clincial use. Although, from gating, we can do all kinds of stuff. the best thing about gated images of the heart is that it is a more accurate representation of the heart. and from it, we can measure things like ejection fraction and myocardial viability, which are useful to physicians.
the end.
leave a comment and tell me what you think.
I thought I would talk a bit about my research, for those of you who care. If you don't care, please find your way to the back button.
Actually, I will try to make this short. I want to give a brief synopsis, but still give enough details so that everyone is properly satisfied and not confuseled.
What I have been doing for almost 2 years now is working on a research PET scanner. PET scanners detect radioactive emissions that are injected into a patient. In a clincal setting, they are often used to detect cancerous lesions, b/c some flavors of injected radionuclide will go where there is a realitive high metabolic need and/or high blood flow (most tumors). An example of that is below. you can see a higher intensity green spot that suggests cancer. btw, this is a coronal slice of a human patient with a diagosis of breast cancer. the bladder is at the bottom and you can make out the lungs and sholders pretty well. (the bladder has "hot spots" b/c the radioactive molecules are beginning to be excreted, it is not bladder cancer)

In research, PET is used for all kinds of stuff. In fact, I don't even want to talk about it there is so much. our group is focusing on PET applied to cardiac/circulation system. There was a state-of-the-art extrememly high resolution PET imaging system built here on campus for use on research in small animals (rats, mice). It was just up and runnign this summer. IT was my task to preform what is known as "gating". where generally, one signal is timed with another. in this context, the images are timed so that we get 8 PET images that represent a 8th of the cardiac cycle of a rat. That sounds easy, but it isn't. What makes it tricky is that the "events" that make the image are captured for about an hour. it is like setting up a camara and opening the aperature for an hour and allowing light in that long. so obviously, the heart beats many times in that time frame, so the "events" that are recorded have to be organised by when they occured in the cardiac cycle. the image below should clear things up. it is color coded to signify each 8th of the cardiac cycle. an ECG is used to determine the cardiac cycle. and those 'S' things, well, those are precursors to images, so just think of them as images.

so as you can see, the events are orgainsed to different "bins" by when they happened in the ECG, and those events are then "sorted" into "sinograms"(the S things) and then directly turned into images. woohoo!
so, that allows sweet images like these:
(download this, open it)
this image is rotating so you can see all angles (I didn't do that) and also gated (I did that part). this is what is commonly called a "blood pool" image. the radioactive molecules I spoke of earlier go where the blood is. the moving blob at the top is the heart and the two decending things are the vena cava and the decending aorta (i think) of a rat. the bigger moving blob is the blood moving in and out the left ventrical, and the smaller moving blob is the blood moving in and out of the right ventrical. So, simply put, i did that. i made it look as though the heart is beating. before, the iamge wouldn't be moving at all and the motion would cause a smearing effect that would make the heart look kinda always open (diastole). this specific kind of image is mostly just cool to look at, it doesn't have much clincial use. Although, from gating, we can do all kinds of stuff. the best thing about gated images of the heart is that it is a more accurate representation of the heart. and from it, we can measure things like ejection fraction and myocardial viability, which are useful to physicians.
the end.
leave a comment and tell me what you think.
# posted by fooiemcgoo : 1:34 AM

Comments:
<< Home
I think it looks like swell work. I think you should explain how it will be built upon and will have clinical applications later on.

thanks!
it has clincal applications now, i am not the first to be doing this, i am just the first to be doing it on a small animal PET with ~1mm resolution.
here are the applications for humans:
"and from it, we can measure things like ejection fraction and myocardial viability, which are useful to physicians."
I guess what I should have said was do you think anyone knows what "ejection fraction and mycardial viability" means?
oh right.
to measure myocardial viabilty is to measure if the heart tissue is dead or alive. if the heart tissue has been ishemic for a long period of time (heart attack) then the tissue can become infarcted, which means it dies and is replace with scar tissue.
ejection fraction is the ratio of blood output that is squeezed out of the left ventricle to the total volume of the left ventricle. so if you have a 50% ejection fraction, half is being squeezed out each time. this is a indicator of how healthy the heart muscle is.
what any doctor will tell you is that you can use echocardiography to measure ejection fraction. but, with cardiac gated PET, you can get highly accurate and sensitve measures of the degree and site of infarcted tissues. you can also get ejection fraction, which can tell you the degree of which the infarcted tissues are effecting the function of the heart, and you can even distinquish infarcted tissue from "hybernating" or "stunned" heart tissue, which is heart tissue that is still alive, but has poor blood flow due to a heart attack.
sometimes docs do bypasses on infarcted tissue, and it doesn't help b/c reperfusing dead tissue doesn't help. but it does with hybernating heart tissue.
anyway, the clincal uses aren't as great as the research any damn way. but that is still cool i think.
my baby is due today. horay!
Post a Comment
to measure myocardial viabilty is to measure if the heart tissue is dead or alive. if the heart tissue has been ishemic for a long period of time (heart attack) then the tissue can become infarcted, which means it dies and is replace with scar tissue.
ejection fraction is the ratio of blood output that is squeezed out of the left ventricle to the total volume of the left ventricle. so if you have a 50% ejection fraction, half is being squeezed out each time. this is a indicator of how healthy the heart muscle is.
what any doctor will tell you is that you can use echocardiography to measure ejection fraction. but, with cardiac gated PET, you can get highly accurate and sensitve measures of the degree and site of infarcted tissues. you can also get ejection fraction, which can tell you the degree of which the infarcted tissues are effecting the function of the heart, and you can even distinquish infarcted tissue from "hybernating" or "stunned" heart tissue, which is heart tissue that is still alive, but has poor blood flow due to a heart attack.
sometimes docs do bypasses on infarcted tissue, and it doesn't help b/c reperfusing dead tissue doesn't help. but it does with hybernating heart tissue.
anyway, the clincal uses aren't as great as the research any damn way. but that is still cool i think.
my baby is due today. horay!
<< Home
![]()